Aviation data2026EN
CrashAtlas
18,243 accidents from 1919 to 2026, placed where they happened — so a century of aviation history can be read geographically instead of as a list.
- Data platform
- Web App
- Backend
- SEO
- Subscriptions
- Industry
- Aviation data
- Engagement
- Ongoing
- Team
- 1 designer · 2 engineers
- Platforms
- Interactive map · Archive pages · Premium tier · Editorial
01
Challenge
Aviation accident data exists in public sources, but it is scattered, inconsistently formatted and almost never geocoded. Turning it into something you can explore means solving ingestion and normalisation before you can even think about the interface.
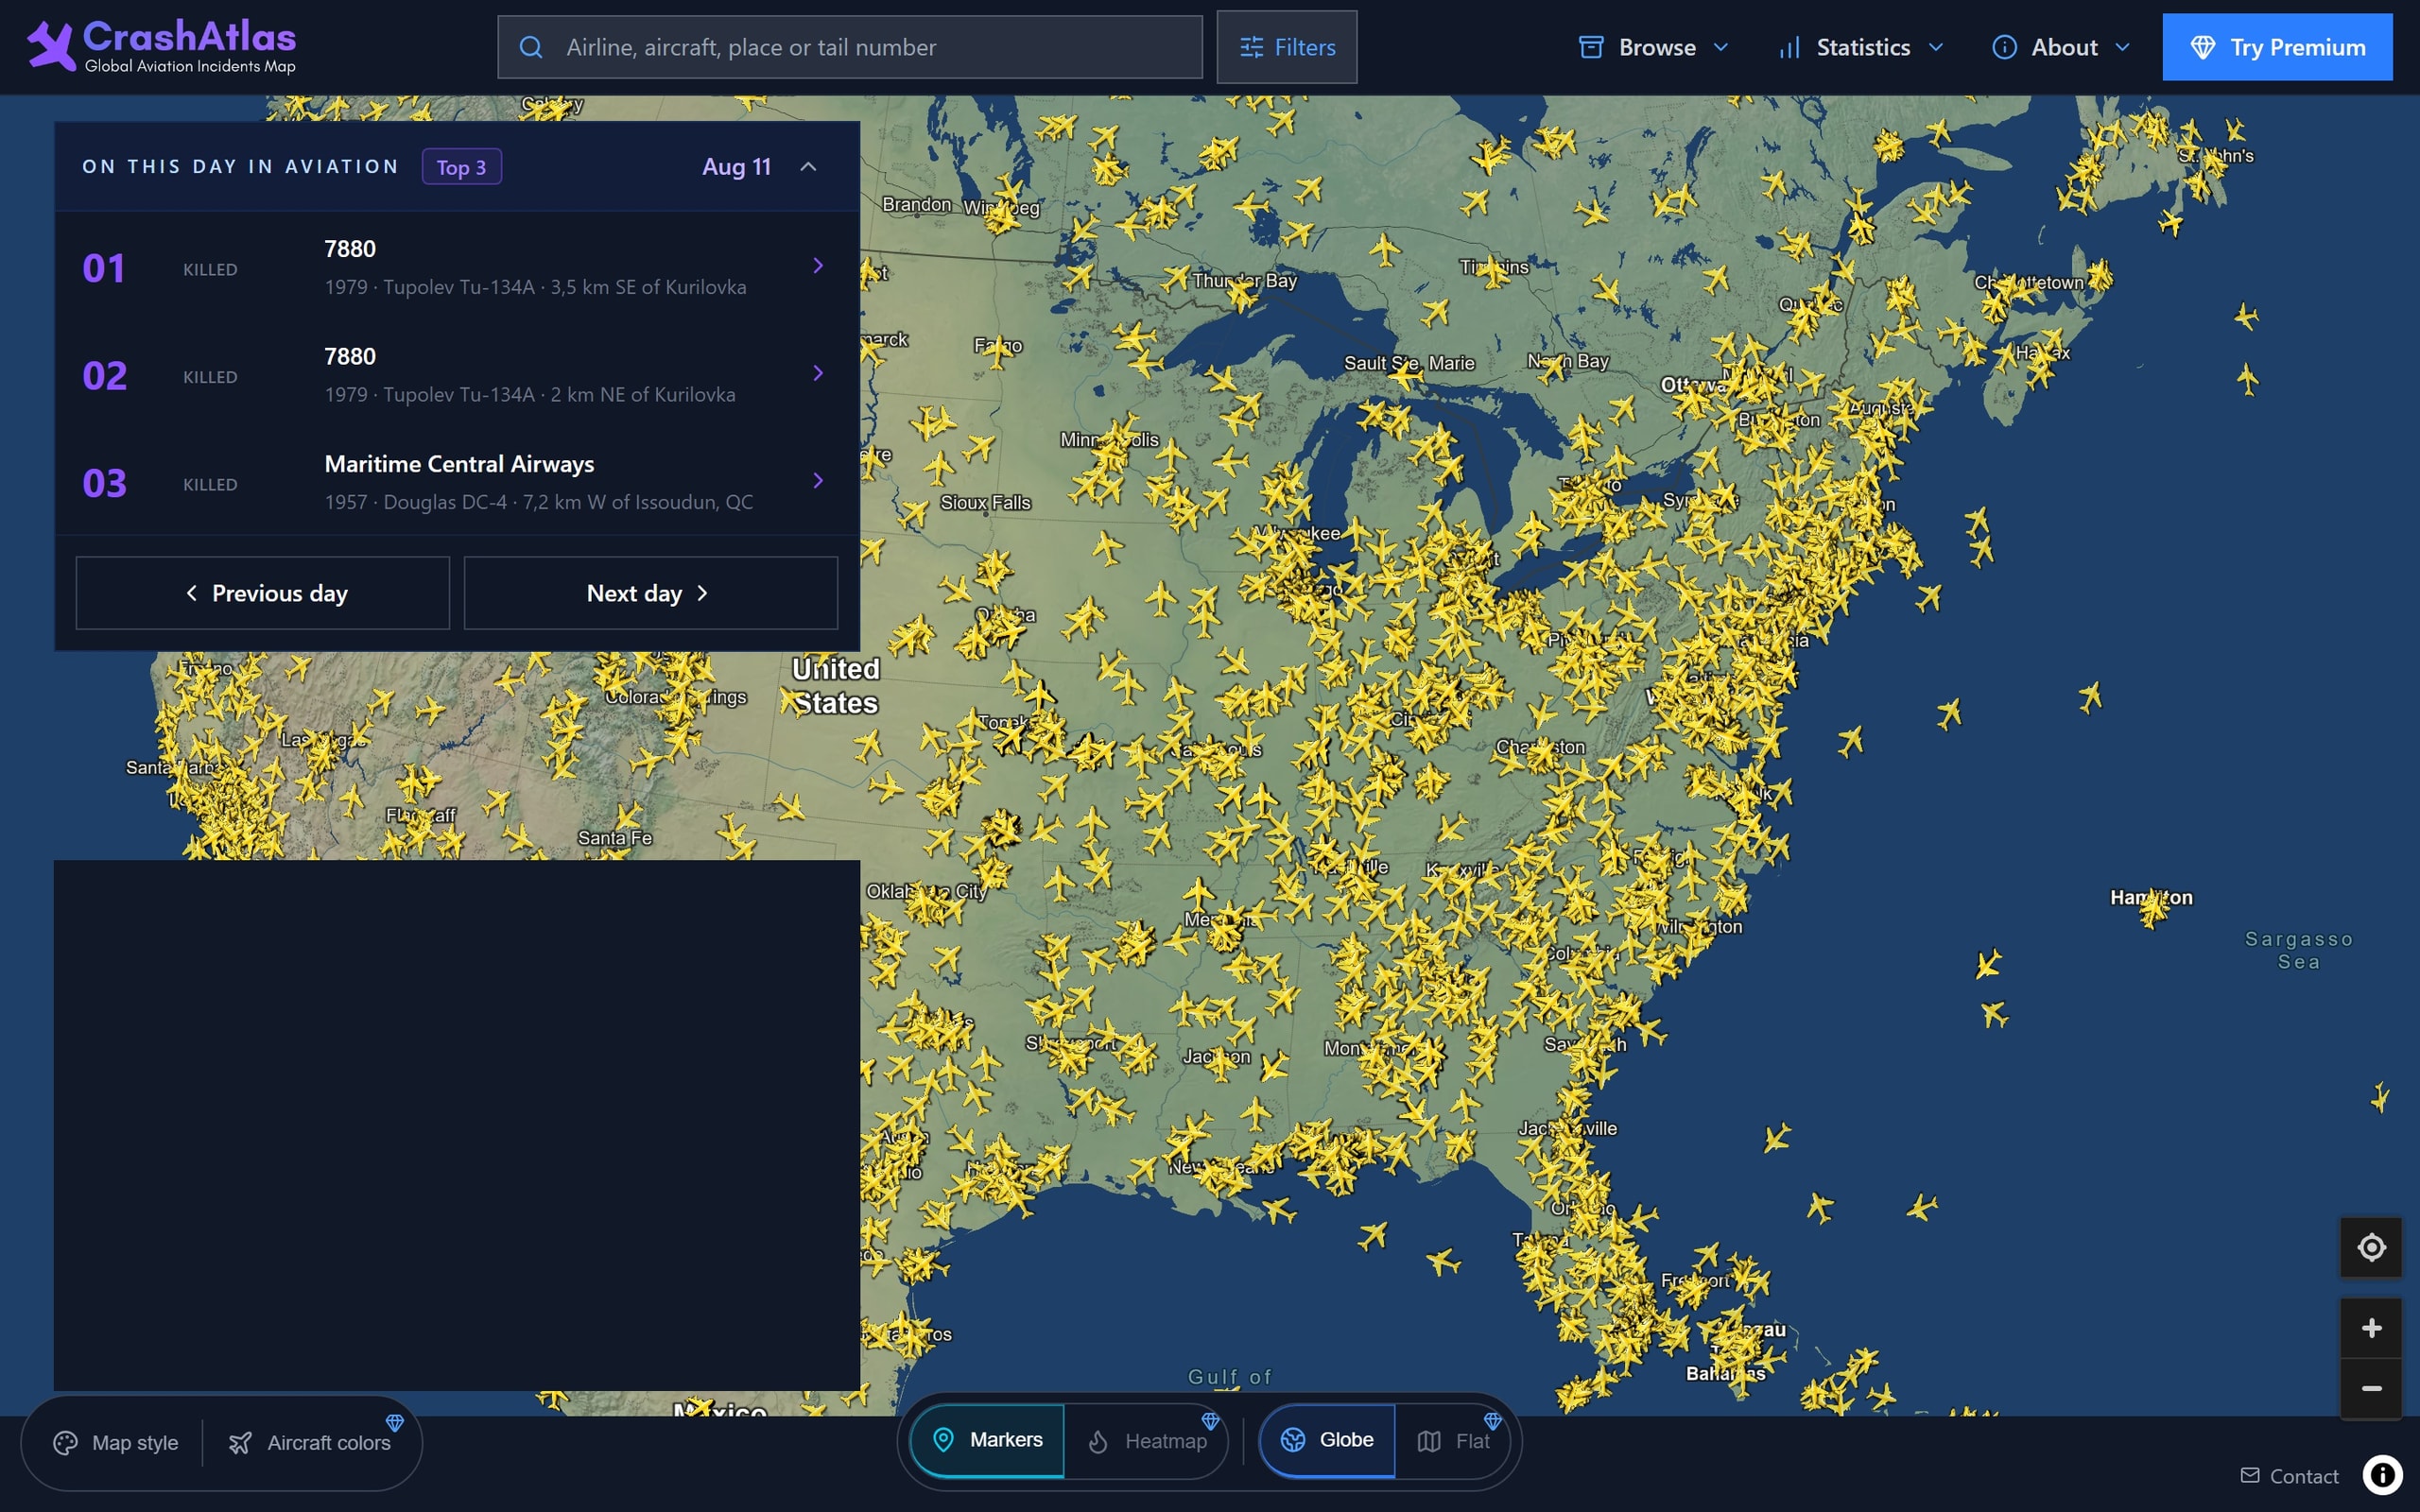
The map is the product, and a map with eighteen thousand markers is a performance problem, an accessibility problem and an SEO problem at the same time: search engines cannot read a canvas.
- Records
- 18,243 accidents, 1919–2026
- Fatalities recorded
- 127,254
- Coverage
- 108 years
02
Solution
A normalisation pipeline turns heterogeneous public sources into one record shape — date, operator, airframe, location, cause, fatalities — with geocoding and de-duplication as explicit, reviewable steps.
The map clusters server-side by region and streams only what the current viewport needs, so panning stays smooth at full archive scale.
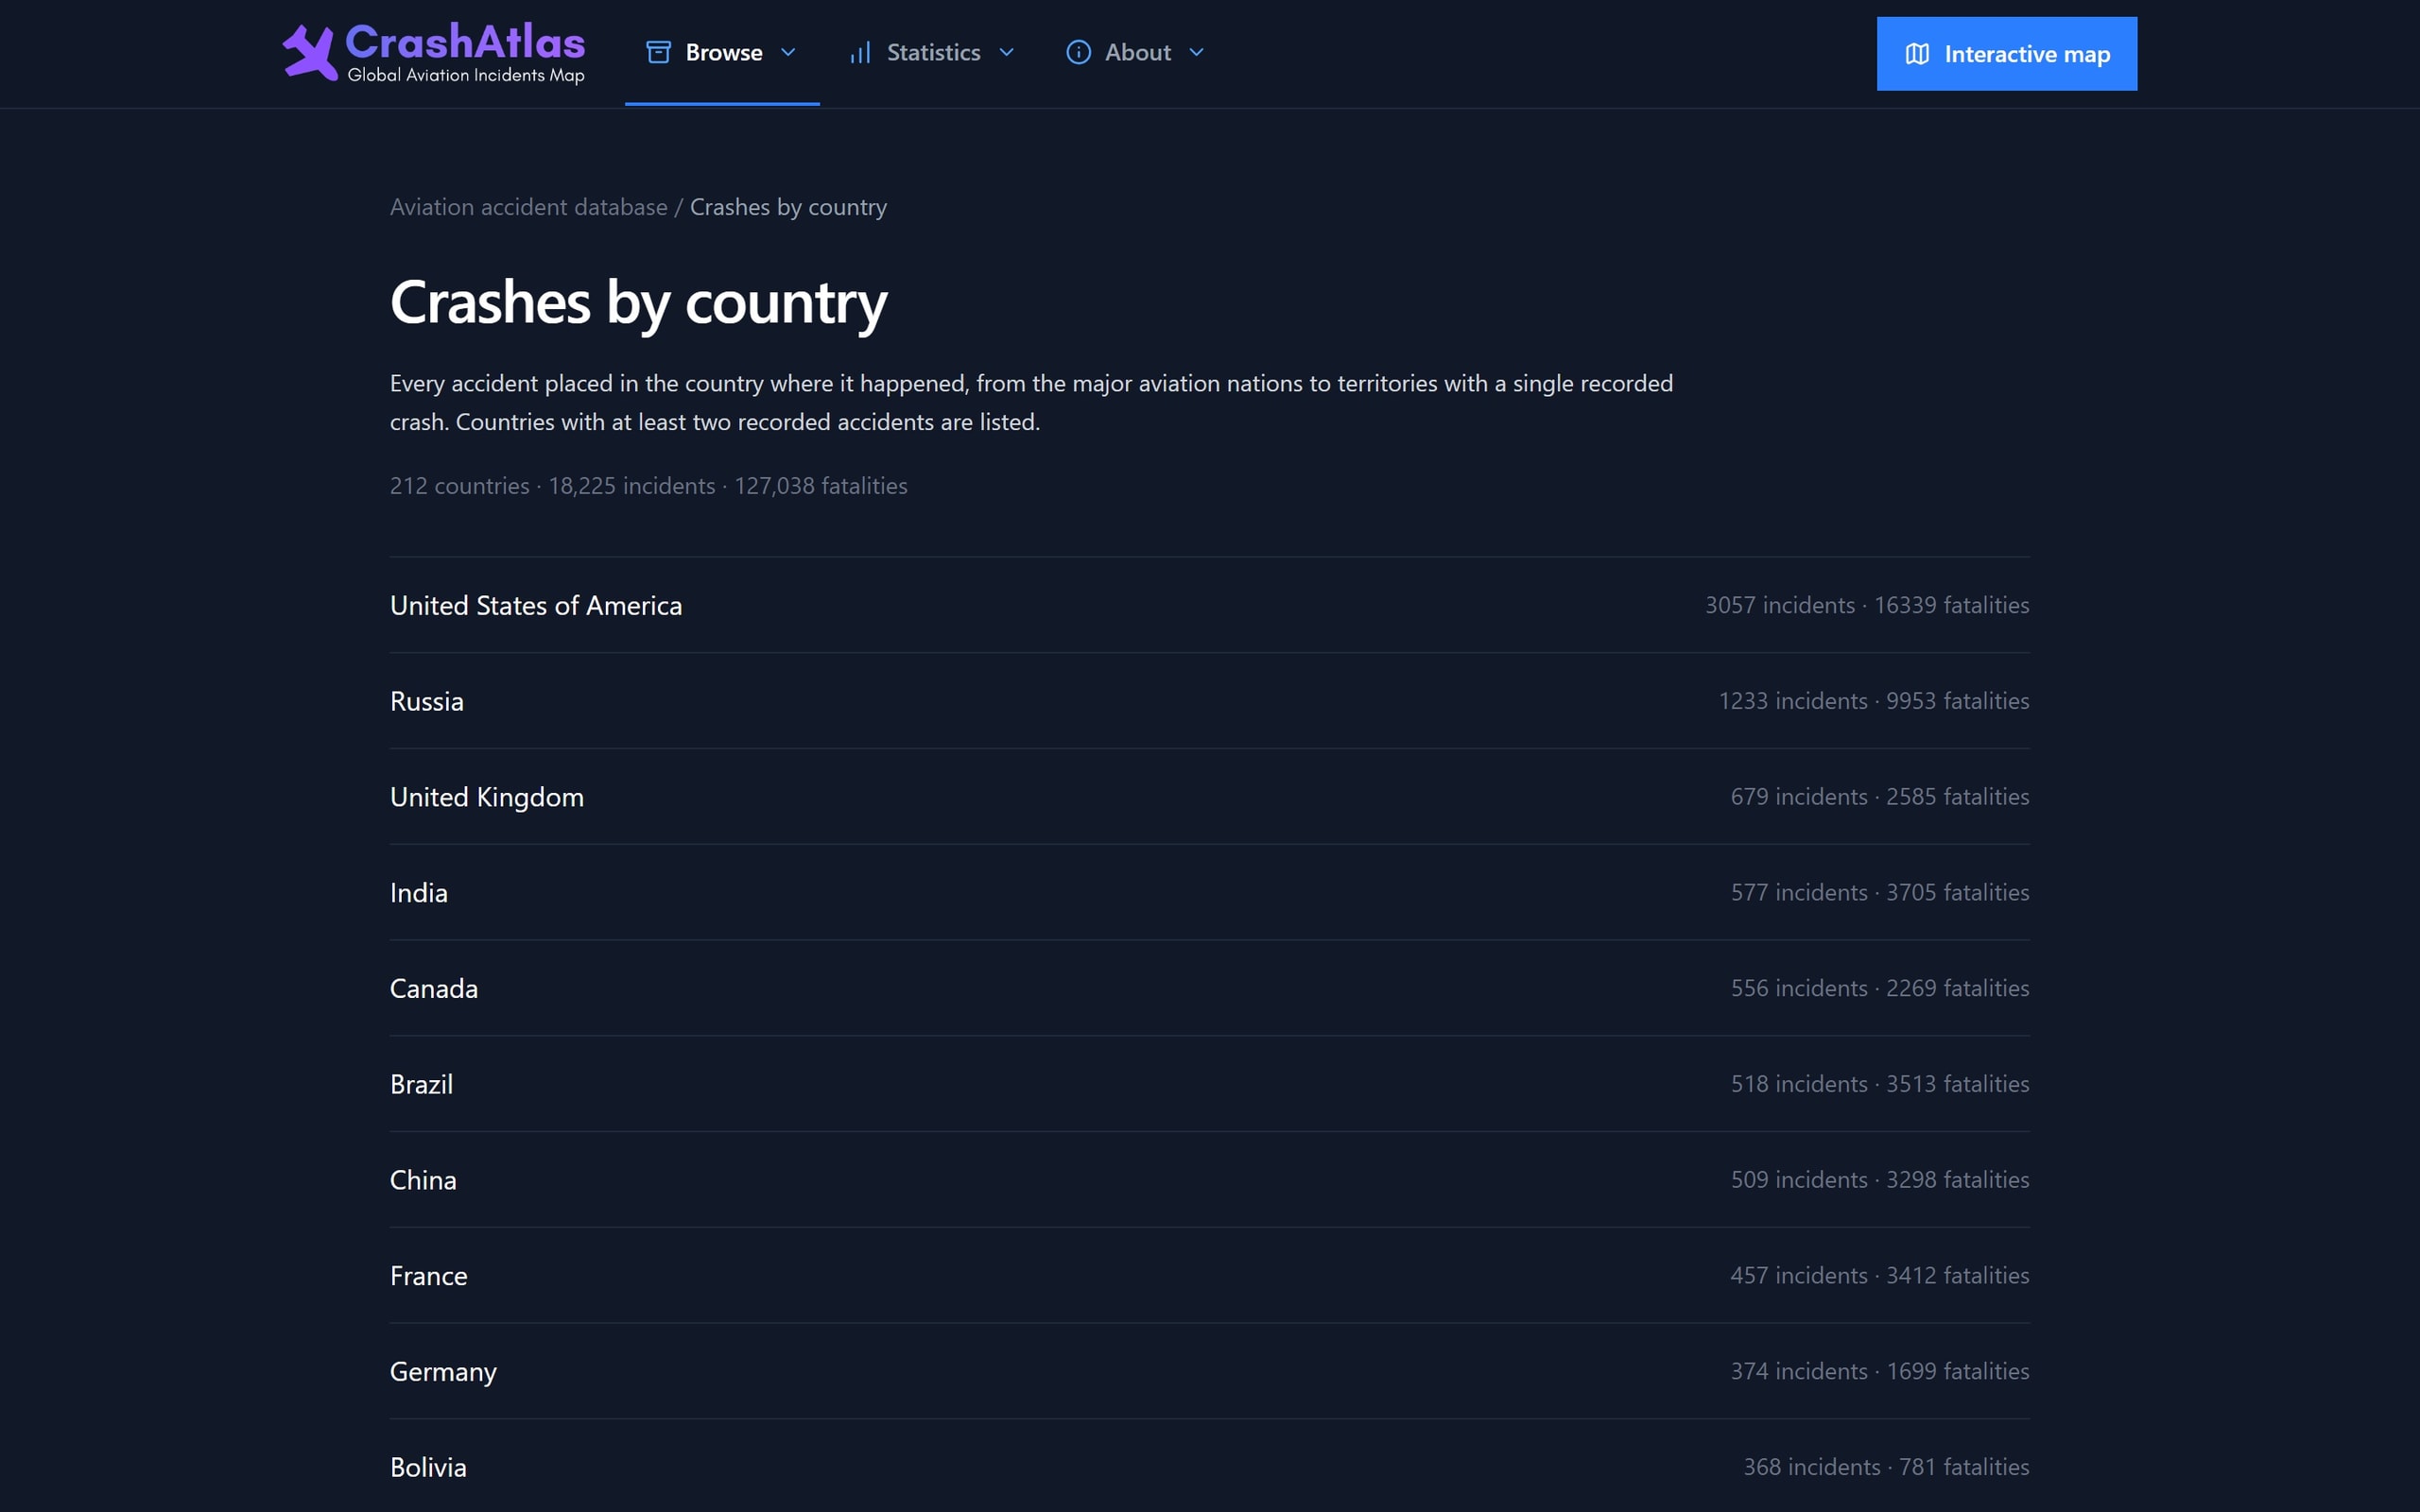
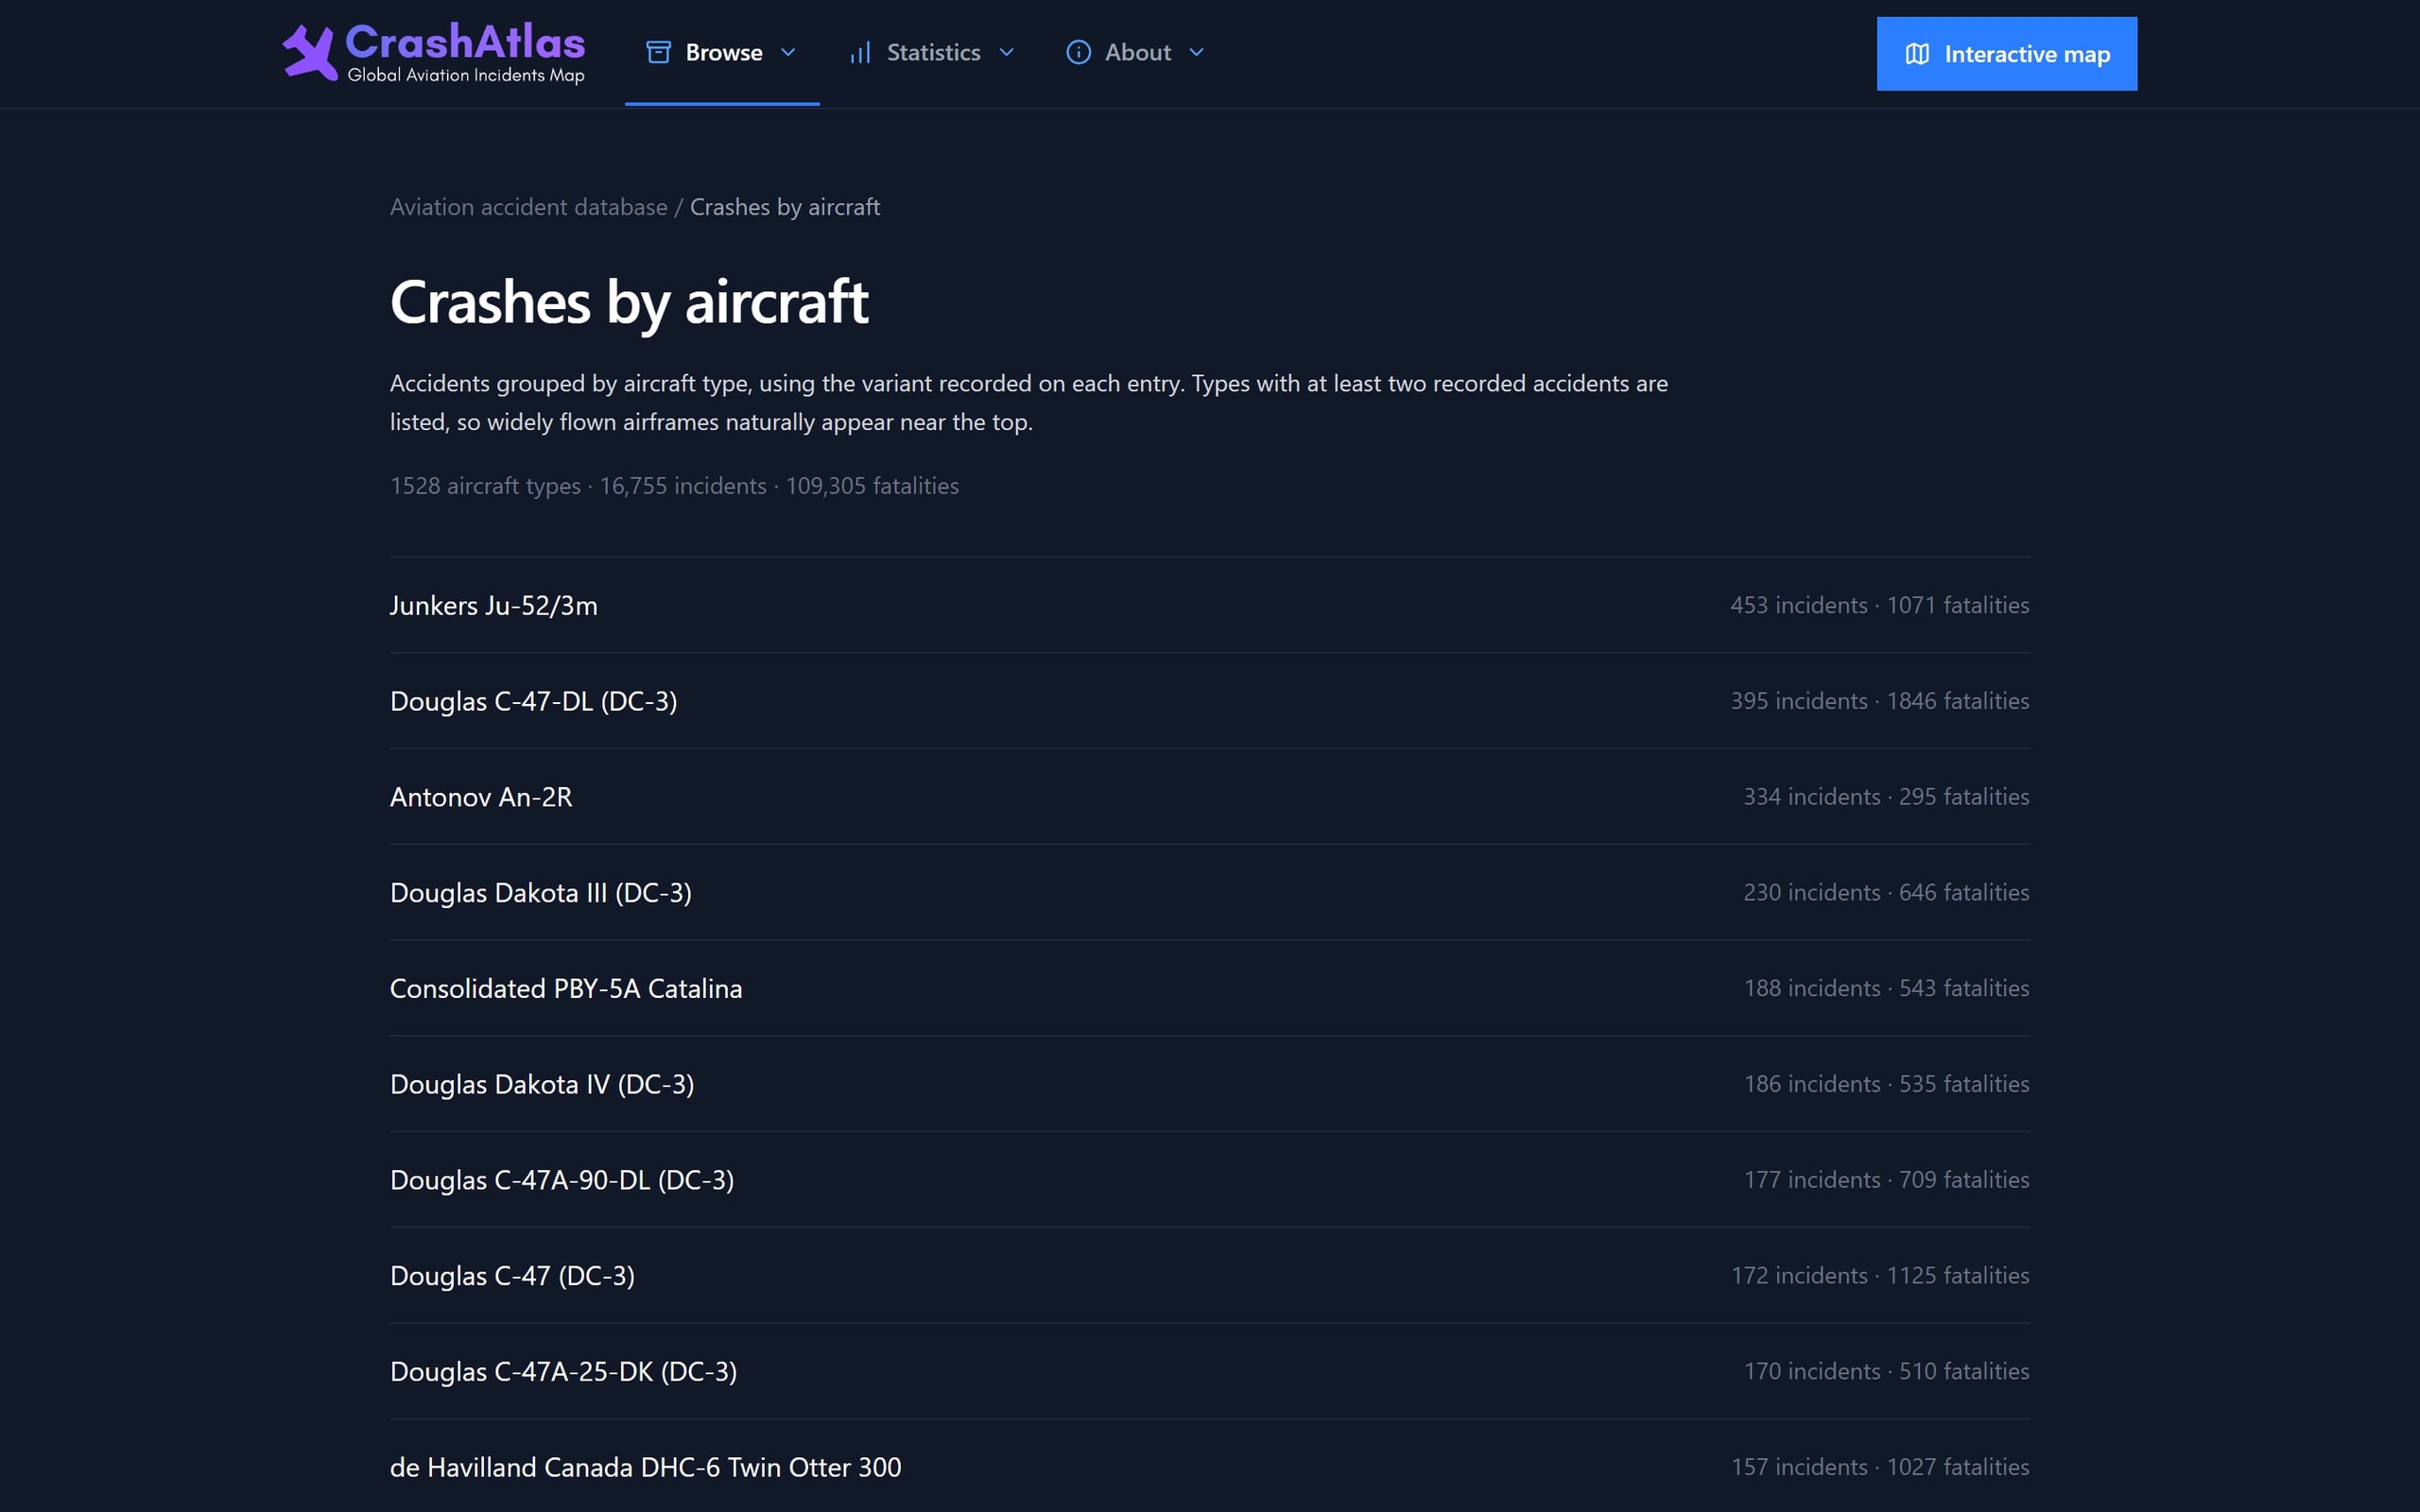
Every dimension of the data is also a set of ordinary, crawlable pages: by country, by year, by airline, by aircraft, by cause. The map is the experience; the pages are the index — and they are the fallback when the map cannot load.
- Ingestion
- Normalise · geocode · de-duplicate
- Map
- Server-side clustering, viewport streaming
- Discoverability
- Five programmatic archive dimensions
03
Architecture
- L0Public sourcesHeterogeneous
- L1IngestionNormalise + geocode
- L2PostgreSQLCanonical records
- L3Cluster APIViewport queriesArchive pagesISR by dimension
- L4Interactive mapClientBrowse & searchClientPremiumSubscriptions
Connections (7)
- Public sources → Ingestion
- Ingestion → PostgreSQL
- PostgreSQL → Cluster API
- PostgreSQL → Archive pages · generate
- Cluster API → Interactive map
- Archive pages → Browse & search
- Browse & search → Premium · gated records
04
UX
Two audiences share the site: someone following a specific historical accident, and someone exploring patterns. The map serves the second, the archive pages serve the first, and every marker has a permanent page behind it.
The map's loading state is not a spinner — it explains what the map does and links straight into the browsable archive, so a slow connection never becomes a dead end.
- Entry points
- Map for exploration · pages for lookup
- Degradation
- Loading state links to the full archive
05
UI
The subject matter sets the tone: factual, restrained, no dramatisation. Records are presented as archive entries with their sources attributable.
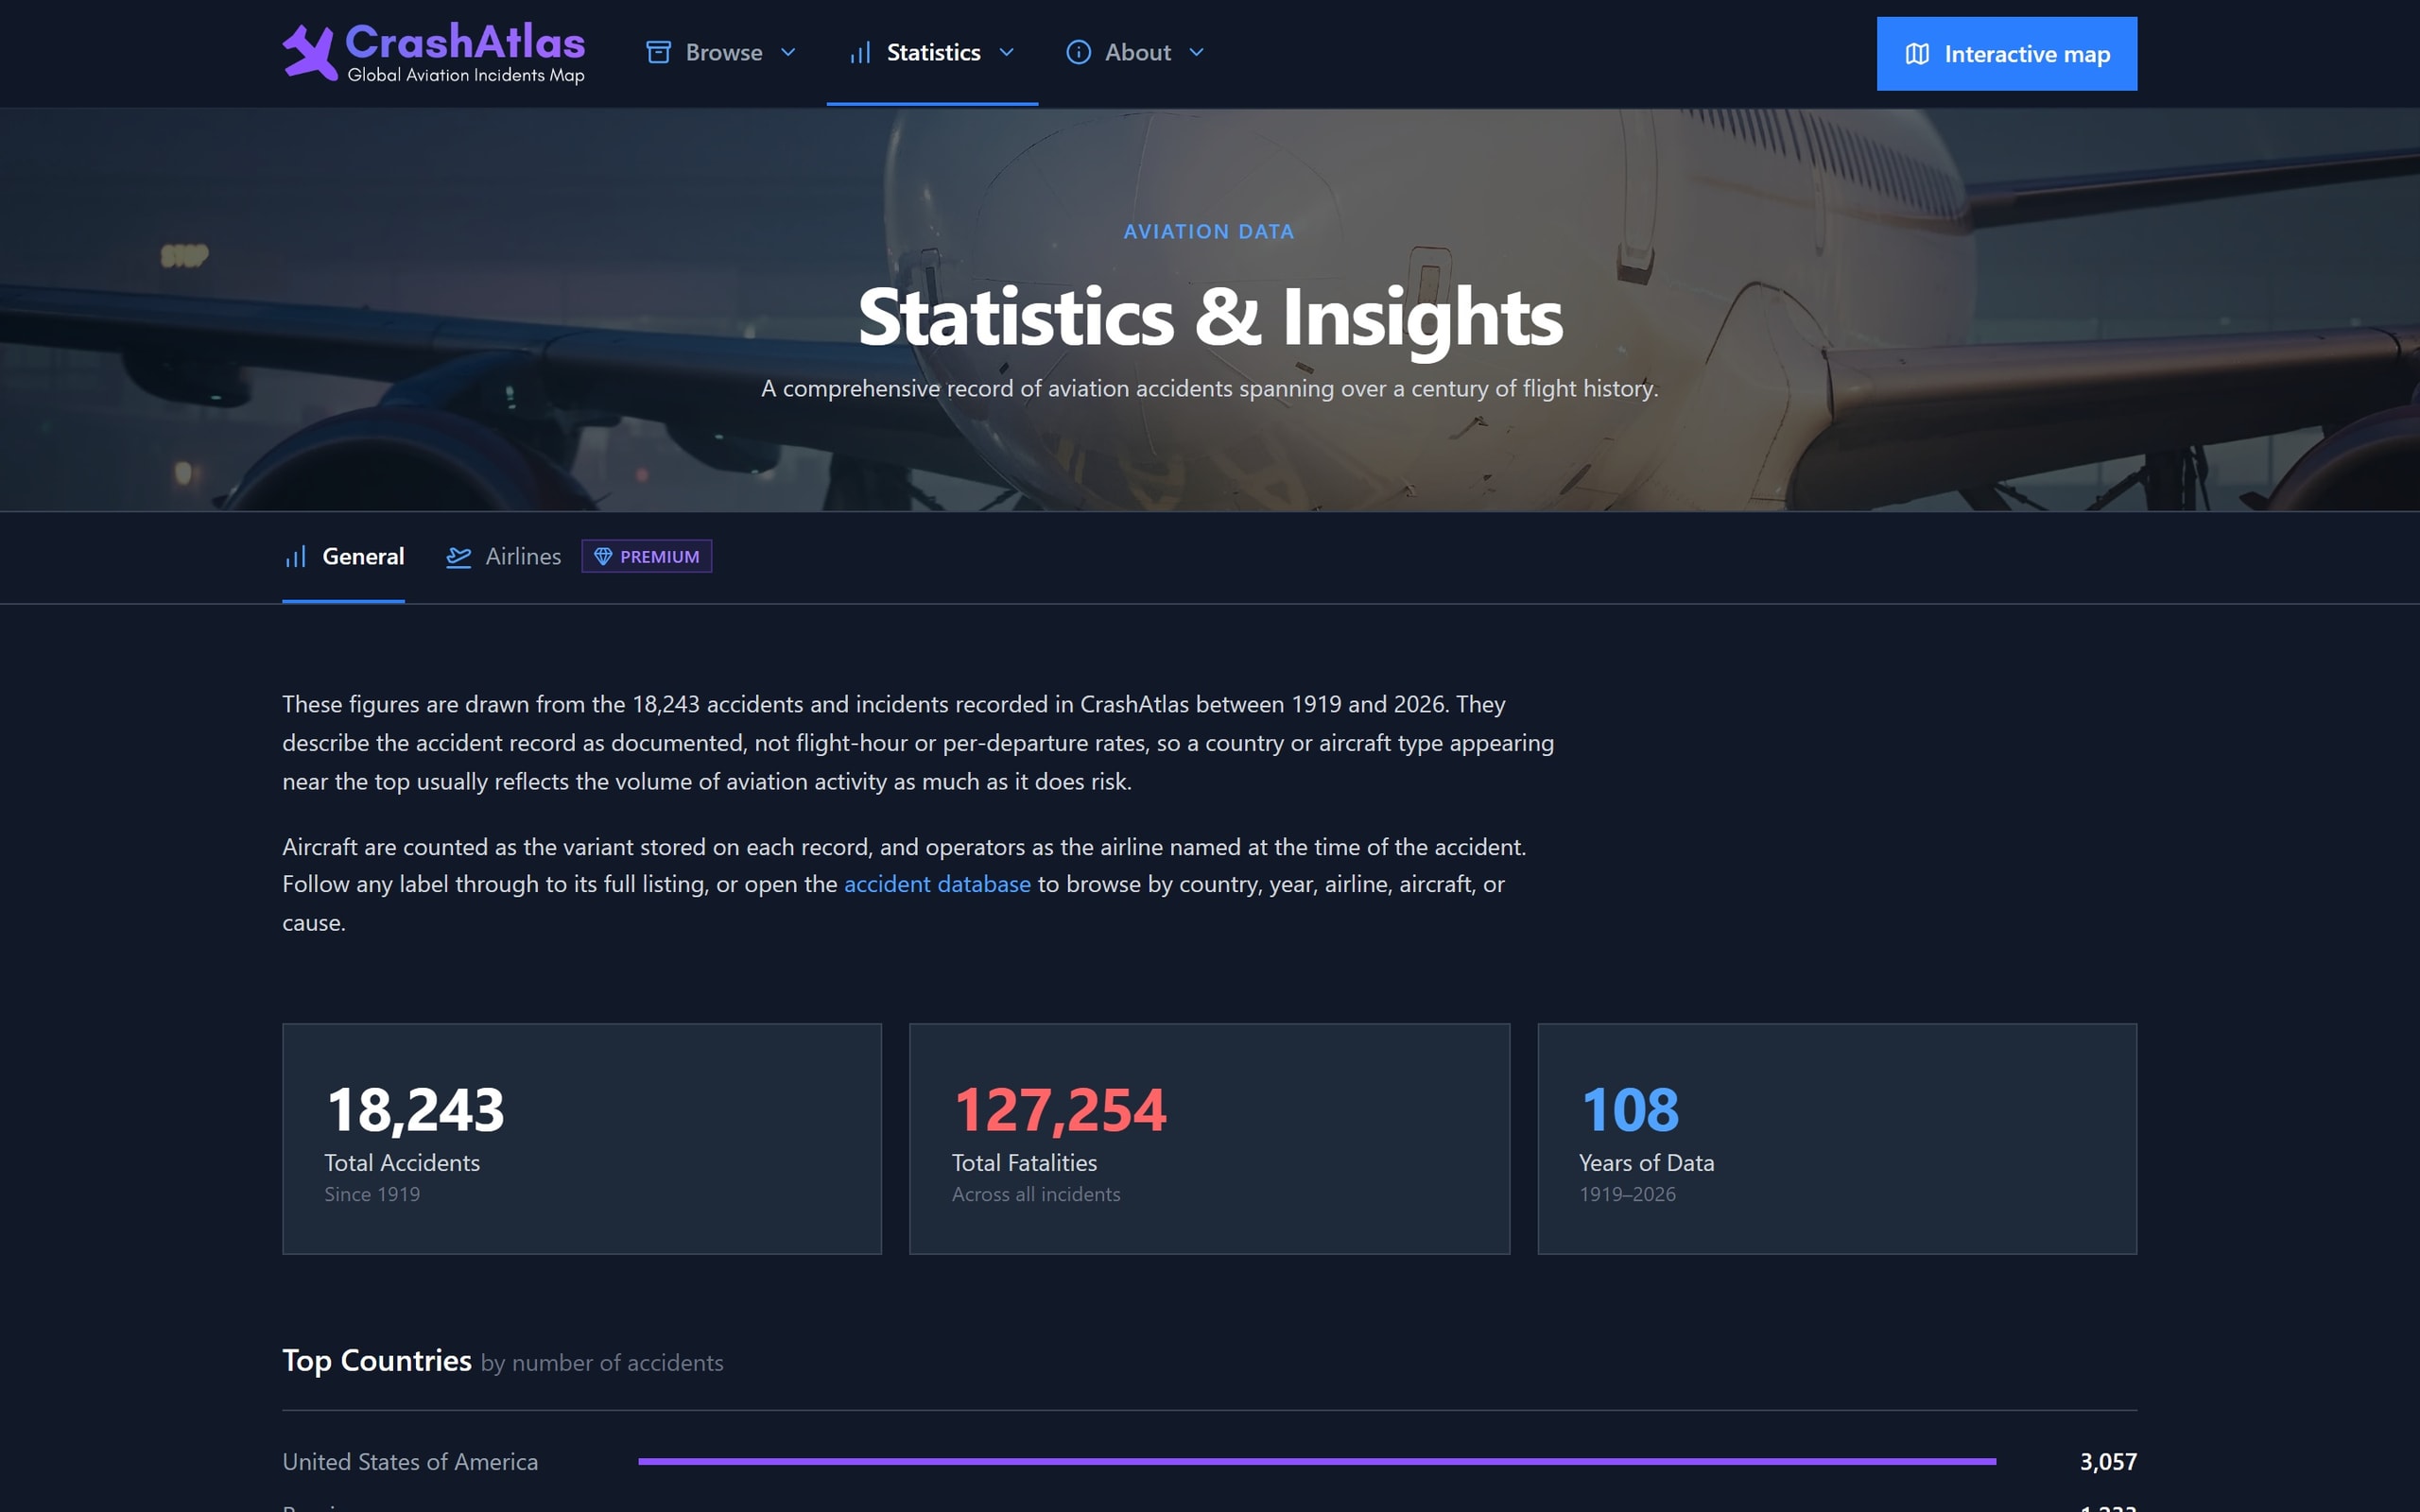
Density is deliberate — the deadliest-accidents list, statistics and browse dimensions are all readable above the fold on a laptop.
06
Development
Archive pages are statically generated per dimension and revalidated on ingestion, so tens of thousands of pages stay fast and current without a rebuild.
The map library is code-split and loaded only when the viewport reaches it, keeping the initial page weight independent of the heaviest component on the site.
Premium records sit behind a subscription check enforced on the server, never in the client — the paywall is not a CSS class.
07
What it does
Interactive crash map
Regional clustering, airport and route overlays, viewport-scoped queries.
Archive by country
Where accidents cluster geographically, as crawlable pages.
Archive by year
How the accident record changes decade by decade.
Archive by airline & aircraft
Operator and airframe records, with the full history behind Premium.
Archive by cause
Recurring failure patterns across the record.
Statistics
Countries, aircraft, deadliest years and cumulative totals.
Premium tier
Subscription access to rankings and complete crash records, enforced server-side.
Corrections
A structured route for readers to submit a correction to any record.
08
Integrations & stack
Integrations
- Geocoding
- Subscription billing
- Analytics
- Status monitoring
Frontend
- Next.js
- React
- TypeScript
- Tailwind CSS
- Map rendering
Backend
- Node.js
- PostgreSQL
- Ingestion pipeline
- ISR
Platform
- Subscriptions
- CDN
- Monitoring
09
Where it landed
- 18,243
- Records mapped
- 5
- Archive dimensions
- Full archive
- Map fallback
- Server-enforced
- Paywall
1919 – 2026
Country · year · airline · aircraft · cause
Site works without the map
Premium records never reach the client
A reference work rather than a data dump: the same archive is explorable as a map, browsable as pages, and indexable as a century of records.
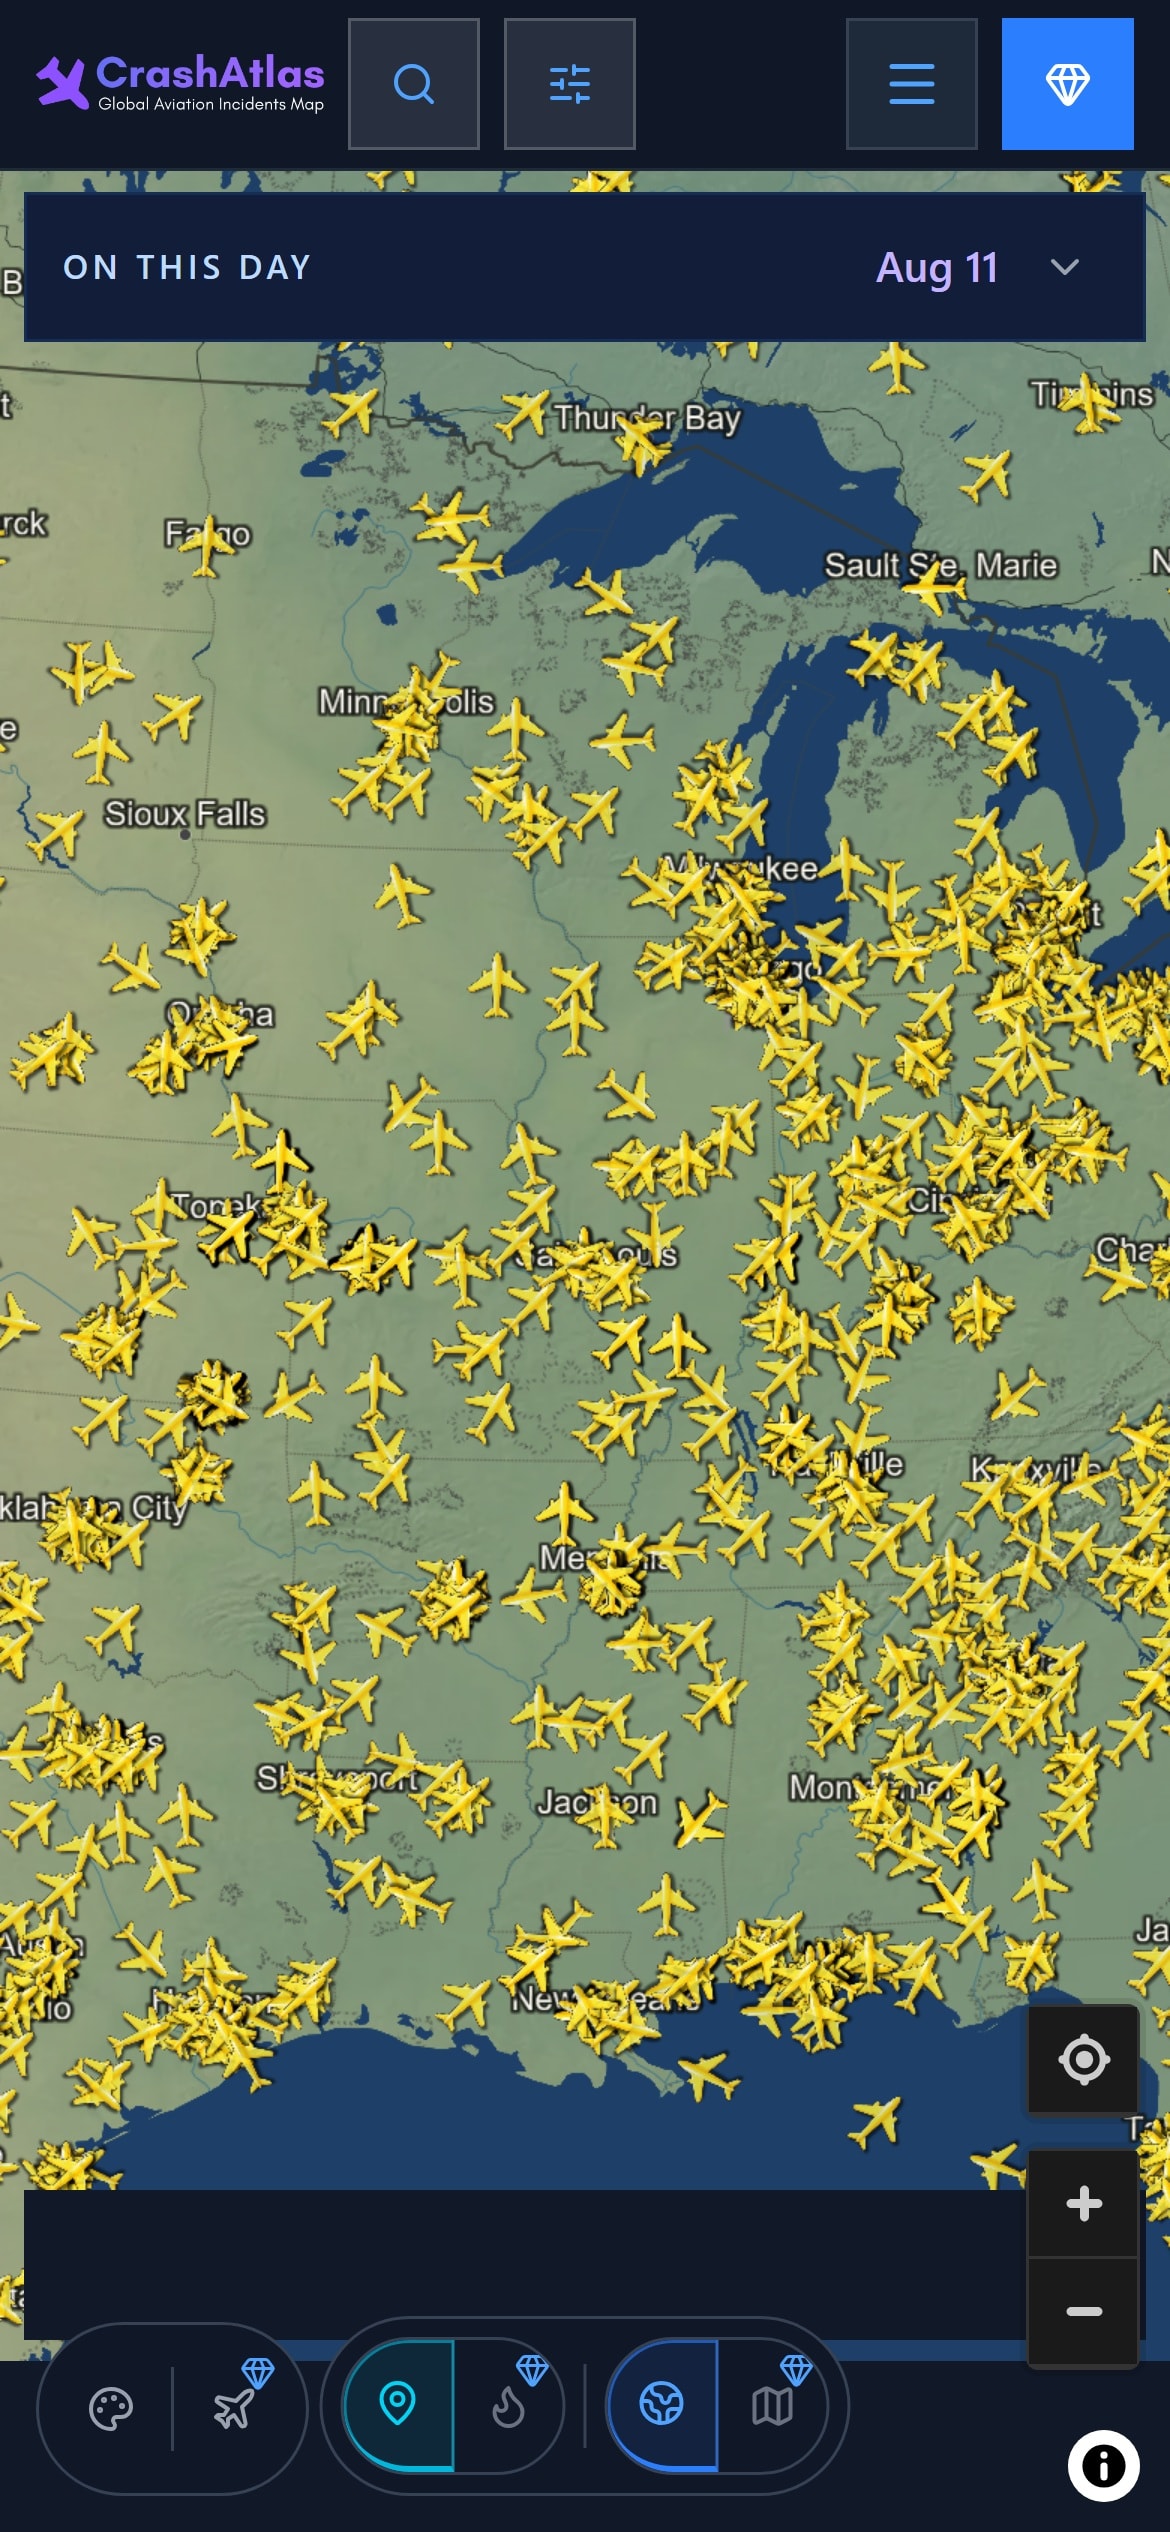
Every build is designed for the phone as its own experience, not as a narrowed desktop layout.
Got a product that should exist by now?Tell us about it.
Describe what has to change in your business. We will work out what that actually takes — including when it takes less than you think.